


Por favor, use este identificador para citar o enlazar este ítem:
http://hdl.handle.net/20.500.11765/7306
Can gridded data represent extreme precipitation events?
Registro completo de metadatos
| Campo DC | Valor | Lengua/Idioma |
|---|---|---|
| dc.contributor.author | Herrera García, Sixto | es_ES |
| dc.contributor.author | Gutiérrez Llorente, José Manuel | es_ES |
| dc.contributor.author | Ancell, Rafael | es_ES |
| dc.contributor.author | Pons Reynés, María Rosa | es_ES |
| dc.contributor.author | Frías Domínguez, María Dolores | es_ES |
| dc.contributor.author | Fernández Fernández, Jesús | es_ES |
| dc.date.accessioned | 2017-07-13T06:31:51Z | - |
| dc.date.available | 2017-07-13T06:31:51Z | - |
| dc.date.issued | 2010 | - |
| dc.identifier.citation | 11IMSC - International Meeting on Statistical Climatology (2010) | es_ES |
| dc.identifier.uri | http://hdl.handle.net/20.500.11765/7306 | - |
| dc.description | Póster presentado en: 11IMSC - International Meeting on Statistical Climatology celebrado del 12 al 16 de Julio de 2010 en Edimburgo | es_ES |
| dc.description.abstract | The analysis and characterization of extreme precipitation at regional scale requires data at high temporal and spatial resolution due to the abrupt variations of this variable in time and space. In recent years there has been an increasing demand for comprehensive regular high-resolution (both in time and space) gridded datasets from different sectors, including hydrology, agriculture and health which are severely affected by extreme events. One of the main shortcomings of gridded datasets is that extreme events can be smoothed during the interpolation process. Heavy rainfall events can be very local and, hence, interpolation with neighboring stations may lead to an underestimation of the precipitation amounts. In this work we study the capability of a high-resolution daily precipitation gridded dataset over Spain (we refer to this dataset as Spain02, Herrera et al 2010) to characterize extreme precipitation. A dense network of 2756 quality-controlled stations was selected to develop the Spain02 grid with a regular 0.2º horizontal resolution covering the period from 1950 to 2003. We study both upper percentiles and the extreme indicators commonly used to characterize extreme precipitation regimes. We also show the performance of the gridded dataset to capture both the intensity and the spatial structure of severe precipitation episodes which constitute characteristic ephemerides of extreme weather in the Iberian peninsula. The results are compared to the 25 Km E-OBS grid (Haylock et al 2008) developed in the ENSEMBLES project, which is the best daily dataset for the whole Europe to date. | es_ES |
| dc.language.iso | eng | es_ES |
| dc.rights | Licencia CC: Reconocimiento–NoComercial–SinObraDerivada CC BY-NC-ND | es_ES |
| dc.subject | Precipitation | es_ES |
| dc.subject | Gridded dataset | es_ES |
| dc.subject | Extremes | es_ES |
| dc.title | Can gridded data represent extreme precipitation events? | es_ES |
| dc.type | info:eu-repo/semantics/conferenceObject | es_ES |
| dc.rights.accessRights | info:eu-repo/semantics/openAccess | es_ES |
| Colecciones: | Otros póster | |
Ficheros en este ítem:
| Fichero | Descripción | Tamaño | Formato | ||
|---|---|---|---|---|---|
| 2010_herrera_IMSC_Pos... | 247,26 kB | Adobe PDF | 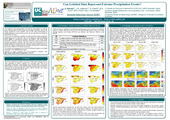 Visualizar/Abrir |


Los ítems de Arcimis están protegidos por una Licencia Creative Commons, salvo que se indique lo contrario.