


Por favor, use este identificador para citar o enlazar este ítem:
http://hdl.handle.net/20.500.11765/13839
Empirical models for estimating air temperature using MODIS Land Surface Temperature (and Spatiotemporal Variables) in the Hurd Peninsula of Livingston Island, Antarctica, between 2000 and 2016
| Título : | Empirical models for estimating air temperature using MODIS Land Surface Temperature (and Spatiotemporal Variables) in the Hurd Peninsula of Livingston Island, Antarctica, between 2000 and 2016 |
| Autor : | Recondo, María del Carmen; Corbea-Pérez, Alejandro; Peón, Juanjo; Pendás, Enrique |
| Palabras clave : | Air temperature; MODIS LST; LOESS; MLR models; Livingston Island; Antarctica |
| Fecha de publicación : | 2022 |
| Editor: | MDPI |
| Citación : | Remote Sensing. 2022, 14(13), 3206 |
| Versión del editor: | https://doi.org/10.3390/rs14133206 |
| Resumen : | In this article, we present empirical models for estimating daily mean air temperature (Ta) in the Hurd Peninsula of Livingston Island (Antarctica) using Moderate Resolution Imaging Spectroradiometer (MODIS) Land Surface Temperature (LST) data and spatiotemporal variables. The models were obtained and validated using the daily mean Ta from three Spanish in situ meteorological stations (AEMET stations), Juan Carlos I (JCI), Johnsons Glacier (JG), and Hurd Glacier (HG), and three stations in our team’s monitoring sites, Incinerador (INC), Reina Sofía (SOF), and Collado Ramos (CR), as well as daytime and nighttime Terra-MODIS LST and Aqua-MODIS LST data between 2000 and 2016. Two types of multiple linear regression (MLR) models were obtained: models for each individual station (for JCI, INC, SOF, and CR—not for JG and HG due to a lack of data) and global models using all stations. In the study period, the JCI and INC stations were relocated, so we analyzed the data from both locations separately (JCI1 and JCI2; INC1 and INC2). In general, the best individual Ta models were obtained using daytime Terra LST data, the best results for CR being followed by JCI2, SOF, and INC2 (R2 = 0.5–0.7 and RSE = 2 °C). Model cross validation (CV) yielded results similar to those of the models (for the daytime Terra LST data: R2CV = 0.4–0.6, RMSECV = 2.5–2.7 °C, and bias = −0.1 to 0.1 °C). The best global Ta model was also obtained using daytime Terra LST data (R2 = 0.6 and RSE = 2 °C; in its validation: R2CV = 0.5, RMSECV = 3, and bias = −0.03), along with the significant (p < 0.05) variables: linear time (t) and two time harmonics (sine-cosine), distance to the coast (d), slope (s), curvature (c), and hour of LST observation (H). Ta and LST data were carefully corrected and filtered, respectively, prior to its analysis and comparison. The analysis of the Ta time series revealed different cooling/warming trends in the locations, indicating a complex climatic variability at a spatial scale in the Hurd Peninsula. The variation of Ta in each station was obtained by the Locally Weighted Regression (LOESS) method. LST data that was not “good quality” usually underestimated Ta and were filtered, which drastically reduced the LST data (<5% of the studied days). Despite the shortage of “good” MODIS LST data in these cold environments, all months were represented in the final dataset, demonstrating that the MODIS LST data, through the models obtained in this article, are useful for estimating long-term trends in Ta and generating mean Ta maps at a global level (1 km2 spatial resolution) in the Hurd Peninsula of Livingston Island. |
| URI : | http://hdl.handle.net/20.500.11765/13839 |
| ISSN : | 2072-4292 |
| Colecciones: | Artículos científicos 2019-2022 |
Ficheros en este ítem:
| Fichero | Descripción | Tamaño | Formato | ||
|---|---|---|---|---|---|
| RM_Recondo_2022.pdf | 6,15 MB | Adobe PDF | 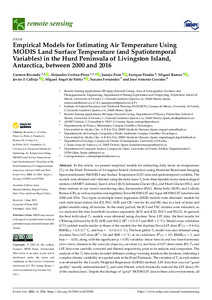 Visualizar/Abrir |


Los ítems de Arcimis están protegidos por una Licencia Creative Commons, salvo que se indique lo contrario.